WinningStrategy.ai Logo
WinningStrategy.ai
Home
Consulting Teams →

Market Research

Growth Strategy

Go-to-Market Strategy

AI Strategy

Project Management

Investment Teams →

Equity Research

Investment Banking

PE/VC

Corporate Teams →

Finance

Marketing

Operations

Pricing
BlogsAI AgentsSlide TemplatesWorkflows
ContactBook a demo
Try for free
Home
PricingContact
Sign InCreate Account
Blog/Finance

Take Up 10x More M&A Mandates
Take Up 10x More M&A Mandates
Finance
September 1, 2026

In finance, time is money.

So why does M&A documentation still take weeks?

The data is already sitting in the data room. What takes time is turning it into the deliverables needed to move a deal forward.

AI can automate the entire M&A documentation lifecycle:

Data Room → Football Field + Trading & Transaction Multiples → Pitch Deck + Financial Model → Commercial & Financial Due Diligence

In 2 days instead of weeks, with every number auditable.

And the real outcome isn't just faster documentation.

It's capacity.

When AI handles the repetitive production work, your team can take on significantly more mandates without adding the same amount of headcount.

Be more ambitious. Take up 10x more mandates.

Why pay consultants to spend weeks producing what AI can produce in minutes?

Consultants don't make M&A faster. They make M&A more expensive.

WinningStrategy.ai helps investment bankers and buy-side teams turn M&A data rooms into deal-ready outputs in minutes.

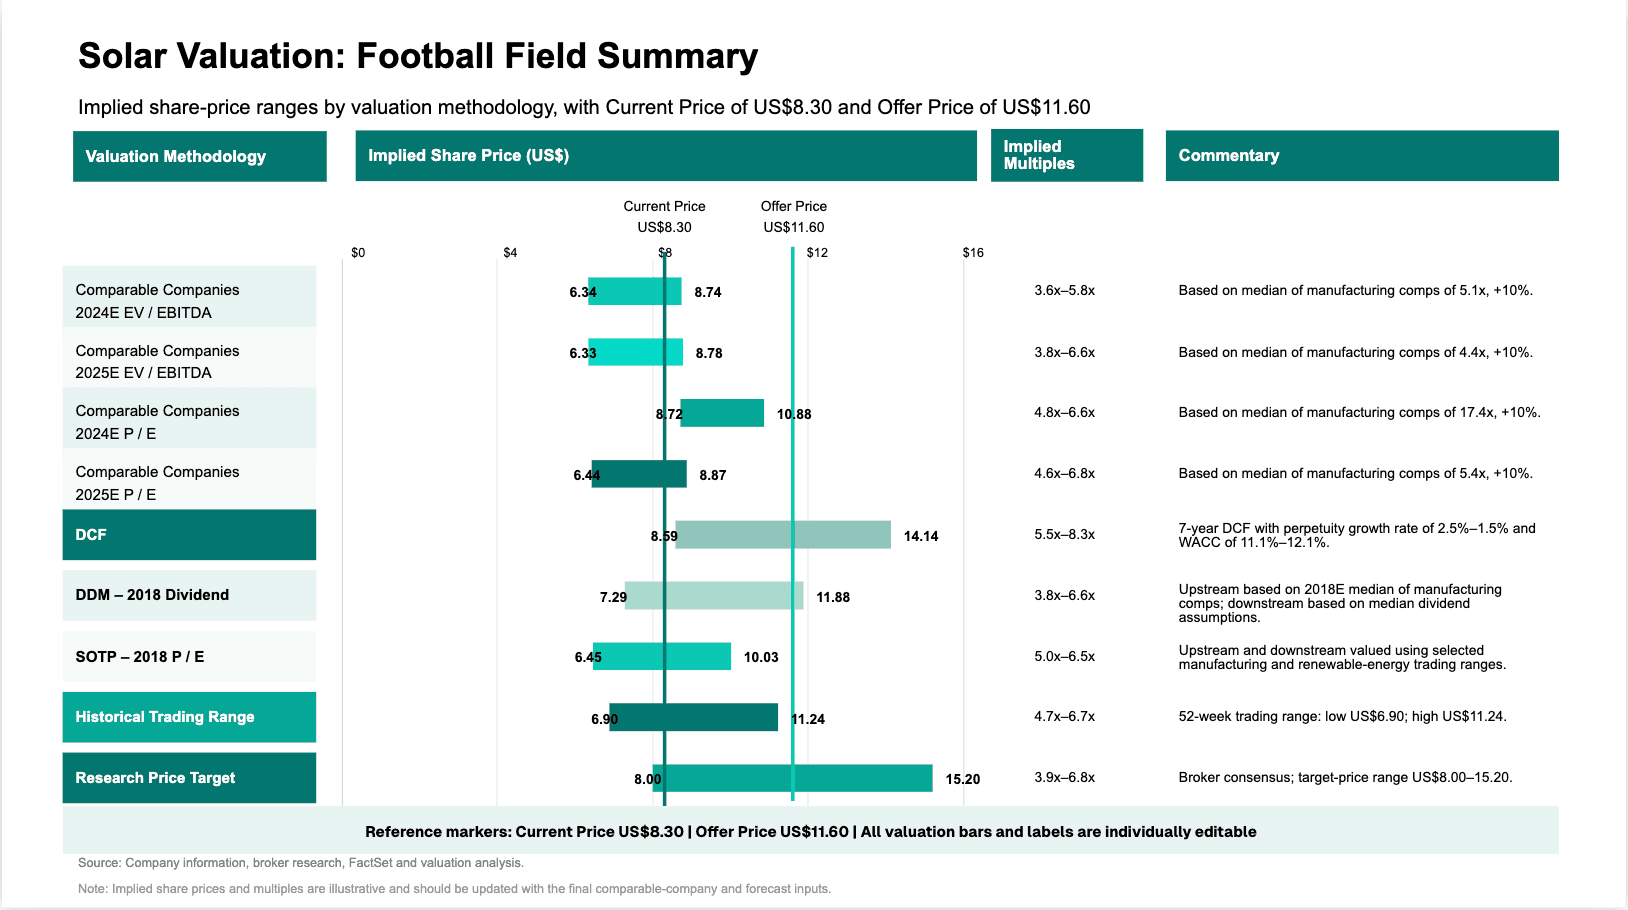
Solar Valuation Summary
Implied share-price ranges by valuation methodology, with Current Price of US$8.30 and Offer Price of US$11.60
Valuation Methodology
Implied Share Price (US$)
Implied Multiples
Commentary
$0
$4
$8
$12
$16
Current Price
US$8.30
Offer Price
US$11.60
Comparable Companies
2024E EV / EBITDA
6.34
8.74
3.6x–5.8x
Based on median of manufacturing comps of 5.1x, +10%.
Comparable Companies
2025E EV / EBITDA
6.33
8.78
3.8x–6.6x
Based on median of manufacturing comps of 4.4x, +10%.
Comparable Companies
2024E P / E
8.72
10.88
4.8x–6.6x
Based on median of manufacturing comps of 17.4x, +10%.
Comparable Companies
2025E P / E
6.44
8.87
4.6x–6.8x
Based on median of manufacturing comps of 5.4x, +10%.
DCF
8.59
14.14
5.5x–8.3x
7-year DCF with perpetuity growth rate of 2.5%–1.5% and WACC of 11.1%–12.1%.
DDM – 2018 Dividend
7.29
11.88
3.8x–6.6x
Upstream based on 2018E median of manufacturing comps; downstream based on median dividend assumptions.
SOTP – 2018 P / E
6.45
10.03
5.0x–6.5x
Upstream and downstream valued using selected manufacturing and renewable-energy trading ranges.
Historical Trading Range
6.90
11.24
4.7x–6.7x
52-week trading range: low US$6.90; high US$11.24.
Research Price Target
8.00
15.20
3.9x–6.8x
Broker consensus; target-price range US$8.00–15.20.
Reference markers: Current Price US$8.30 | Offer Price US$11.60 | All valuation bars and labels are individually editable
Source: Company information, broker research, FactSet and valuation analysis.
Note: Implied share prices and multiples are illustrative and should be updated with the final comparable-company and forecast inputs.
Solar valuation: football field summary, every number traceable to the data room
Primary Technology
EV/MW Trading Multiples
EV/MW Transaction Multiples
Commentary
EV change in %
MW change in %
Wind Parks Command Higher EV/MW Multiples
1.720231.620241.52025
1.520231.520241.62025
1.120231.220241.22025
1.220231.320241.32025
Higher full-load hours support premium wind EV/MW pricing; from 2023 to 2025, projected capacity growth continues to outpace EV growth across renewable energy companies, keeping trading multiples compressed while transaction pricing stabilizes.
Wind commentary
• Trading multiples are projected to ease from 1.7x to 1.5x.
• MW additions continue to grow faster than enterprise value.
• Transaction multiples stay resilient at 1.5x to 1.6x, signaling premium buyer pricing.
Solar commentary
• Trading multiples stabilize around 1.1x to 1.2x.
• Transaction multiples normalize from 1.2x to 1.3x.
• 2025 remains below wind, reflecting lower full-load-hour economics.
EV/MW interpretation

• EV/MW measures enterprise value per MW of installed capacity.
• Wind generally earns higher EV/MW because full-load hours are stronger.
• From 2023 to 2025, MW growth is projected to outpace EV growth for both wind and solar.
• Result: capacity additions keep trading multiples compressed, while transaction pricing shows early stabilization.
Projected changes in EV and MW among renewable energy companies (2023 - 2025)
+8%
+22%
+12%
+18%
Source: Public renewable energy company filings; S&P Capital IQ; company analysis projections
Note: Multiples shown as EV/MW; periods shown for 2023-2025. 2024-2025 values are illustrative projections based on current market trends.
Wind parks command higher EV/MW multiples: trading and transaction comps, pulled straight from the comparables
5562707896881208691827486768478897268626675202120222023202420252026
Russia-Ukraine conflict begins
Demand decline (China lockdowns, unusually warm European winter, USD appreciation)
Weather then expected demand from China reopening
Voluntary OPEC+ output cuts, held as inventory drawdowns
Start of Israel-Hamas War
Red Sea attacks
0-1.520210.600-0.80-1.21.1020220.600-0.52.702.2020231.500.800-10.2020241.30201.802.8020252.403.50403.202026
Supply > Demand = Inventory Build
Demand > Supply = Inventory Draw
Note: Monthly average of Brent crude oil price (USD per barrel)
Crude Oil Prices and Inventories
Brent crude oil spot prices and global inventory changes
Drivers of energy prices in 2026
Supply disruptions lifted Brent prices in early 2026, but rising OPEC+ output and softer demand point to inventory builds and renewed price pressure through 2026
Near-term price spike: Brent rose by around $10/barrel since end-2025 as North American winter outages and Kazakhstan field power disruptions constrained supply.

Supply surplus re-emerging: Higher OPEC+ output and the unwinding of earlier voluntary cuts should shift balances back toward inventory builds in coming months.

Demand remains soft: Weak industrial activity, particularly in China, limits absorption of incremental supply and reinforces downside pressure on prices.

Geopolitics add volatility: US-Iran tensions can trigger short-lived price spikes, but have not changed the broader supply-surplus outlook.
Sources: International Energy Agency, Reuters, U.S. Energy Information Administration, World Bank, Bloomberg, Haver Analytics
Crude oil prices and inventories: the market context identifying the macroeconomic factors
Solar Project Sensitivity Analysis
Base case yields 8.7% unlevered IRR and $6M NPV; value is most exposed to realized power price and capacity factor, requiring downside protection in PPA and EPC terms.
PROJECT IRR: ELECTRICITY PRICE vs CAPACITY FACTOR
Capacity Factor / Price$40/MWh$45/MWh$50/MWh$55/MWh$60/MWh
21%3.8%5.2%6.6%8.0%9.4%
23%4.8%6.3%7.8%9.3%10.8%
25%5.8%7.2%8.7%10.3%11.9%
27%6.7%8.2%9.8%11.5%13.1%
29%7.6%9.2%10.9%12.6%14.3%
PROJECT NPV: CAPEX vs DISCOUNT RATE
Discount Rate / CAPEX$700/kW$775/kW$850/kW$925/kW$1,000/kW
6%$40M$32M$24M$16M$8M
7%$31M$23M$15M$7M($1M)
8%$22M$14M$6M($2M)($10M)
9%$14M$6M($2M)($10M)($18M)
10%$6M($2M)($10M)($18M)($26M)
PROJECT IRR: ELECTRICITY PRICE vs OPEX
OPEX / Price$40/MWh$45/MWh$50/MWh$55/MWh$60/MWh
$10.0/kW-yr6.6%8.0%9.5%11.1%12.7%
$12.5/kW-yr6.2%7.6%9.1%10.7%12.3%
$15.0/kW-yr5.8%7.2%8.7%10.3%11.9%
$17.5/kW-yr5.4%6.8%8.3%9.9%11.5%
$20.0/kW-yr5.0%6.4%7.9%9.5%11.1%
PROJECT NPV: CAPACITY FACTOR vs DISCOUNT RATE
Capacity Factor / WACC6%7%8%9%10%
21%$0M($7M)($13M)($19M)($24M)
23%$10M$3M($3M)($9M)($14M)
25%$24M$15M$6M($2M)($10M)
27%$38M$28M$17M$8M$0M
29%$52M$40M$29M$19M$10M
BASE CASE: 100 MWdc | $50/MWh realized price | 25% capacity factor | $850/kW CAPEX | $15/kW-year OPEX | 8.0% discount rate | 25-year operating life
Source: Illustrative solar project finance model; investment banking analysis.
Note: Unlevered, pre-tax IRR and NPV; all sensitivities hold non-varied assumptions constant. Negative NPV values shown in parentheses.
Financial model: solar project sensitivity analysis with auditable numbers
Transaction Considerations: Adjusted EBITDA
Normalize reported results before valuation reliance; the largest EBITDA adjustments relate to owner compensation, transaction costs, provisions and revenue cut-off timing.
Adjusted EBITDA
USD $0002020A2021A2022AYTD 2022YTD 2023
Reported EBITDA1,5632,1952,6471,7792,071
Non-recurring income(42)(128)(91)(66)(44)
Owner / management salaries315342365274281
Professional fees851121248396
Rent and facilities normalisation6472795961
Transaction and diligence costs-461187285
Inventory and warranty provisions91761098274
Other one-off adjustments3854613745
Total EBITDA adjustments551574765541598
Adjusted EBITDA2,1142,7693,4122,3202,669
Adjusted EBITDA margin13.2%14.5%15.1%14.7%15.6%
YoY growthn/a31.0%23.2%n/a15.0%
Adjusted Revenue
USD $0002020A2021A2022AYTD 2023
Reported revenue15,98719,10522,64117,088
Revenue cut-off adjustment(120)8514095
Customer rebates / credits(64)(91)(118)(76)
Out-of-period sales42(35)(58)(21)
Total revenue adjustments(142)(41)(36)(2)
Adjusted revenue15,84519,06422,60517,086
Commentary and adjustment basis
Commentary: Management's adjusted EBITDA reconciles reported results to a normalized run-rate view by removing non-recurring items, owner compensation differences and transaction-related costs.

Primary adjustment areas: Owner compensation, transaction costs, inventory and warranty provisions, and revenue cut-off timing around period-end shipments.
Takeaway: Adjusted EBITDA expands from $2.1m in 2020A to $3.4m in 2022A and $2.7m YTD 2023; validate salary normalization, transaction costs and provision methodology before relying on the run-rate margin.
Source: Management accounts and company-provided adjustment schedules.
Note: Figures shown in USD thousands; adviser branding from the source image has been omitted.
Financial due diligence: transaction considerations and EBITDA adjustments

Stop paying for hours. Start buying outcomes.

M&A
Investment Banking
Due Diligence
Financial Modeling
Valuation
AI in Finance
Private Equity

AI Analyst that delivers the work of a consulting team, in minutes

Every number auditable, so you can defend it with confidence

Sign up now

Keep reading

  • WinningStrategy AI vs. Microsoft Copilot
  • How to Build a Pricing Strategy Using AI
← Back to All Posts
Winning Strategy - Consulting-grade presentations and analysis with auditable numbers
WinningStrategy.ai

Winning Strategy turns a single prompt into consulting-grade presentations and analysis — grounded in in-depth research where every number is auditable to its source.

Trusted by consultants, strategic sales heads, investment bankers, and executives.

Company

  • Pricing Plans
  • FAQ
  • Contact Us
  • Book a Demo

Follow Us

Privacy PolicyTerms of ServiceRefund PolicyShipping Policy

© 2026 WinningStrategy.ai. All rights reserved.

Winning Strategy Consulting Private Limited | Consulting-grade Presentations & Analysis with Auditable Numbers