WinningStrategy AI vs. Microsoft Copilot
Many consulting firms use Microsoft Copilot because Microsoft is already an enterprise technology partner.
That does not necessarily mean Copilot is the best tool for consulting work.
When an AI tool is selected at the enterprise level, consultants often end up working with the default tool rather than one designed around the way consulting work actually gets done.
We wanted to test that difference.
We gave Microsoft Copilot and WinningStrategy.ai the same 5-slide market research brief and compared the resulting work.
The difference was clear.
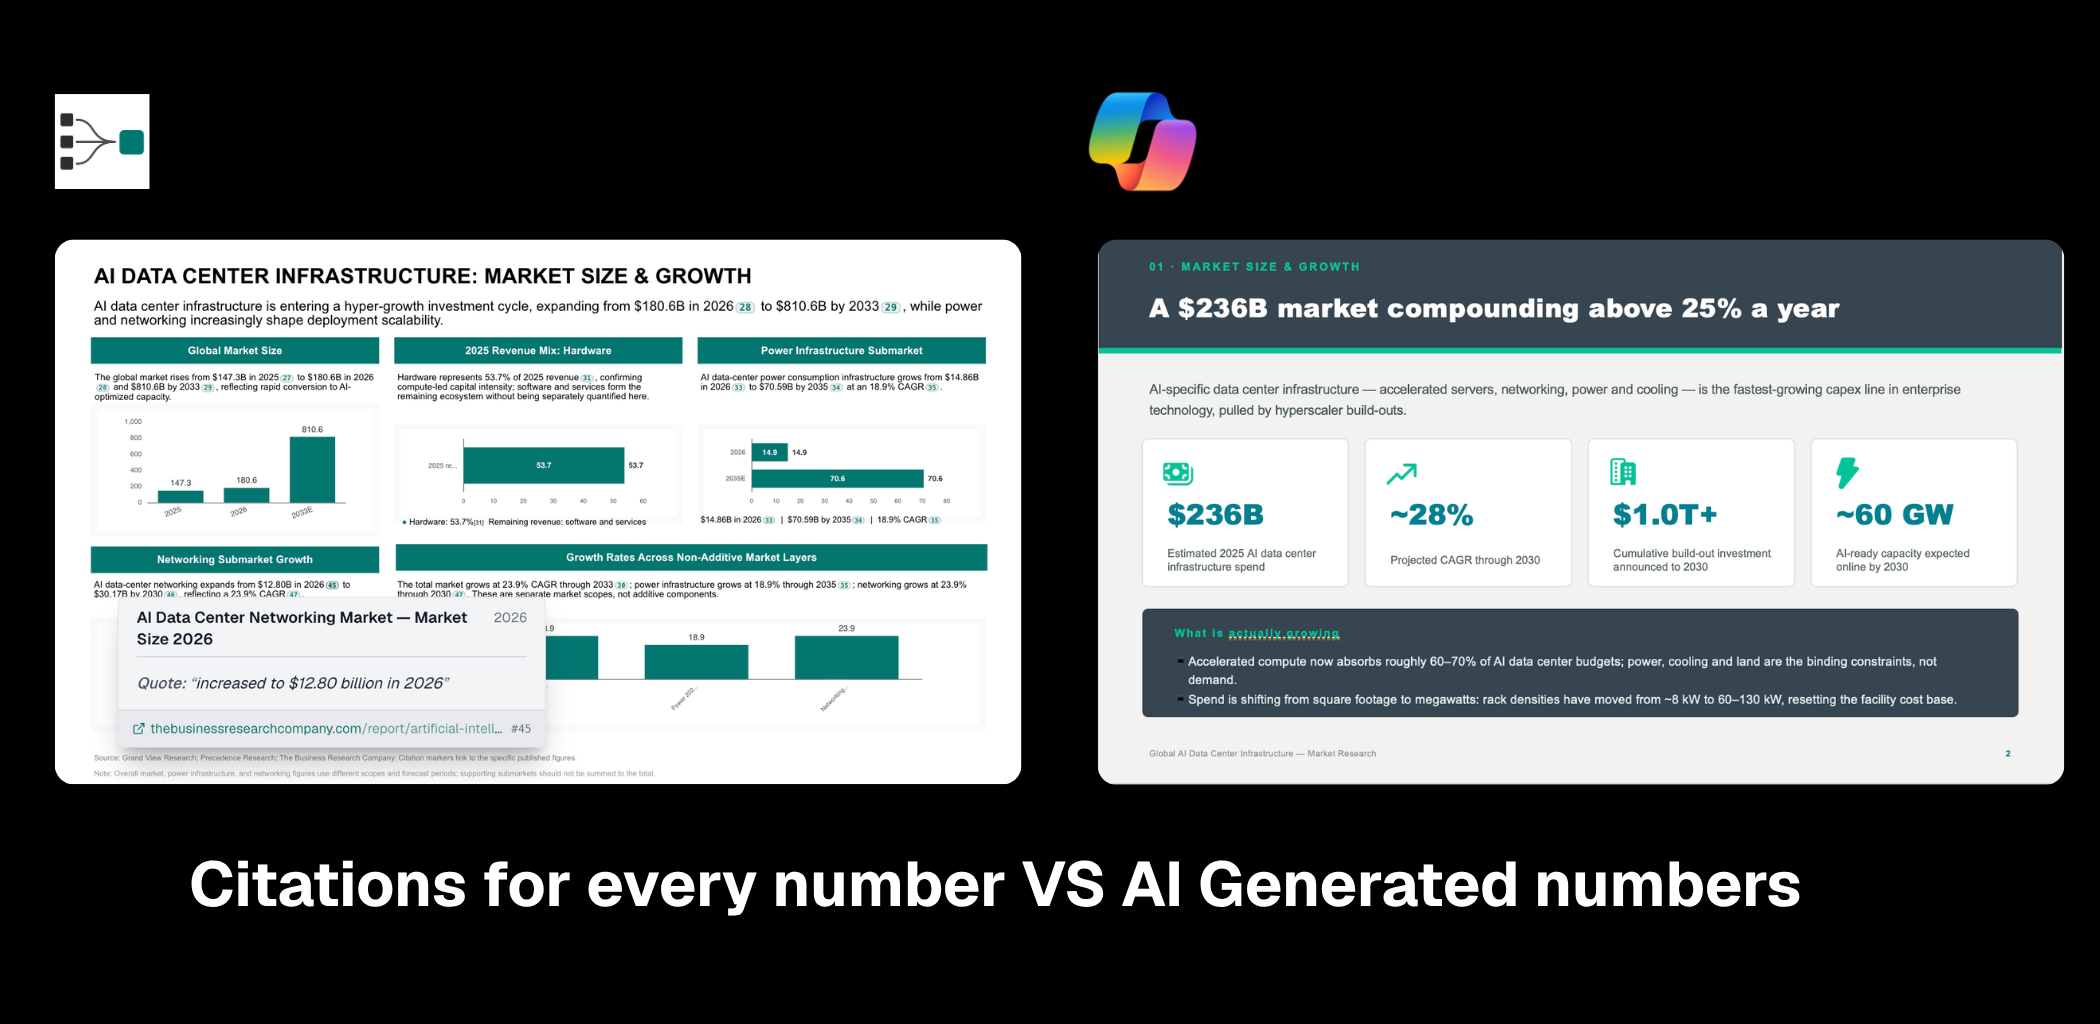
1. Citations for Every Number vs. AI-Generated Numbers
The first test was whether the AI could actually research the market and support its findings with evidence.
Copilot: Dropped numbers onto the slide with no source attached. Market size, growth rate, spend figures — all presented with the same confidence, regardless of whether they came from a real dataset or were generated to fill a chart. There is no way to tell the difference just by looking at the slide, and that is the problem. An unsourced number that happens to be right looks identical to one that is wrong.
WinningStrategy.ai: Attached a citation to every figure, so each data point traces back to the report, filing, or dataset it came from. If a number looks off, you can check it in seconds instead of re-researching the entire slide.
In client work, this is not a nice-to-have. A single unsourced number in a board deck can undermine an otherwise strong analysis the moment someone asks "where did this come from?"
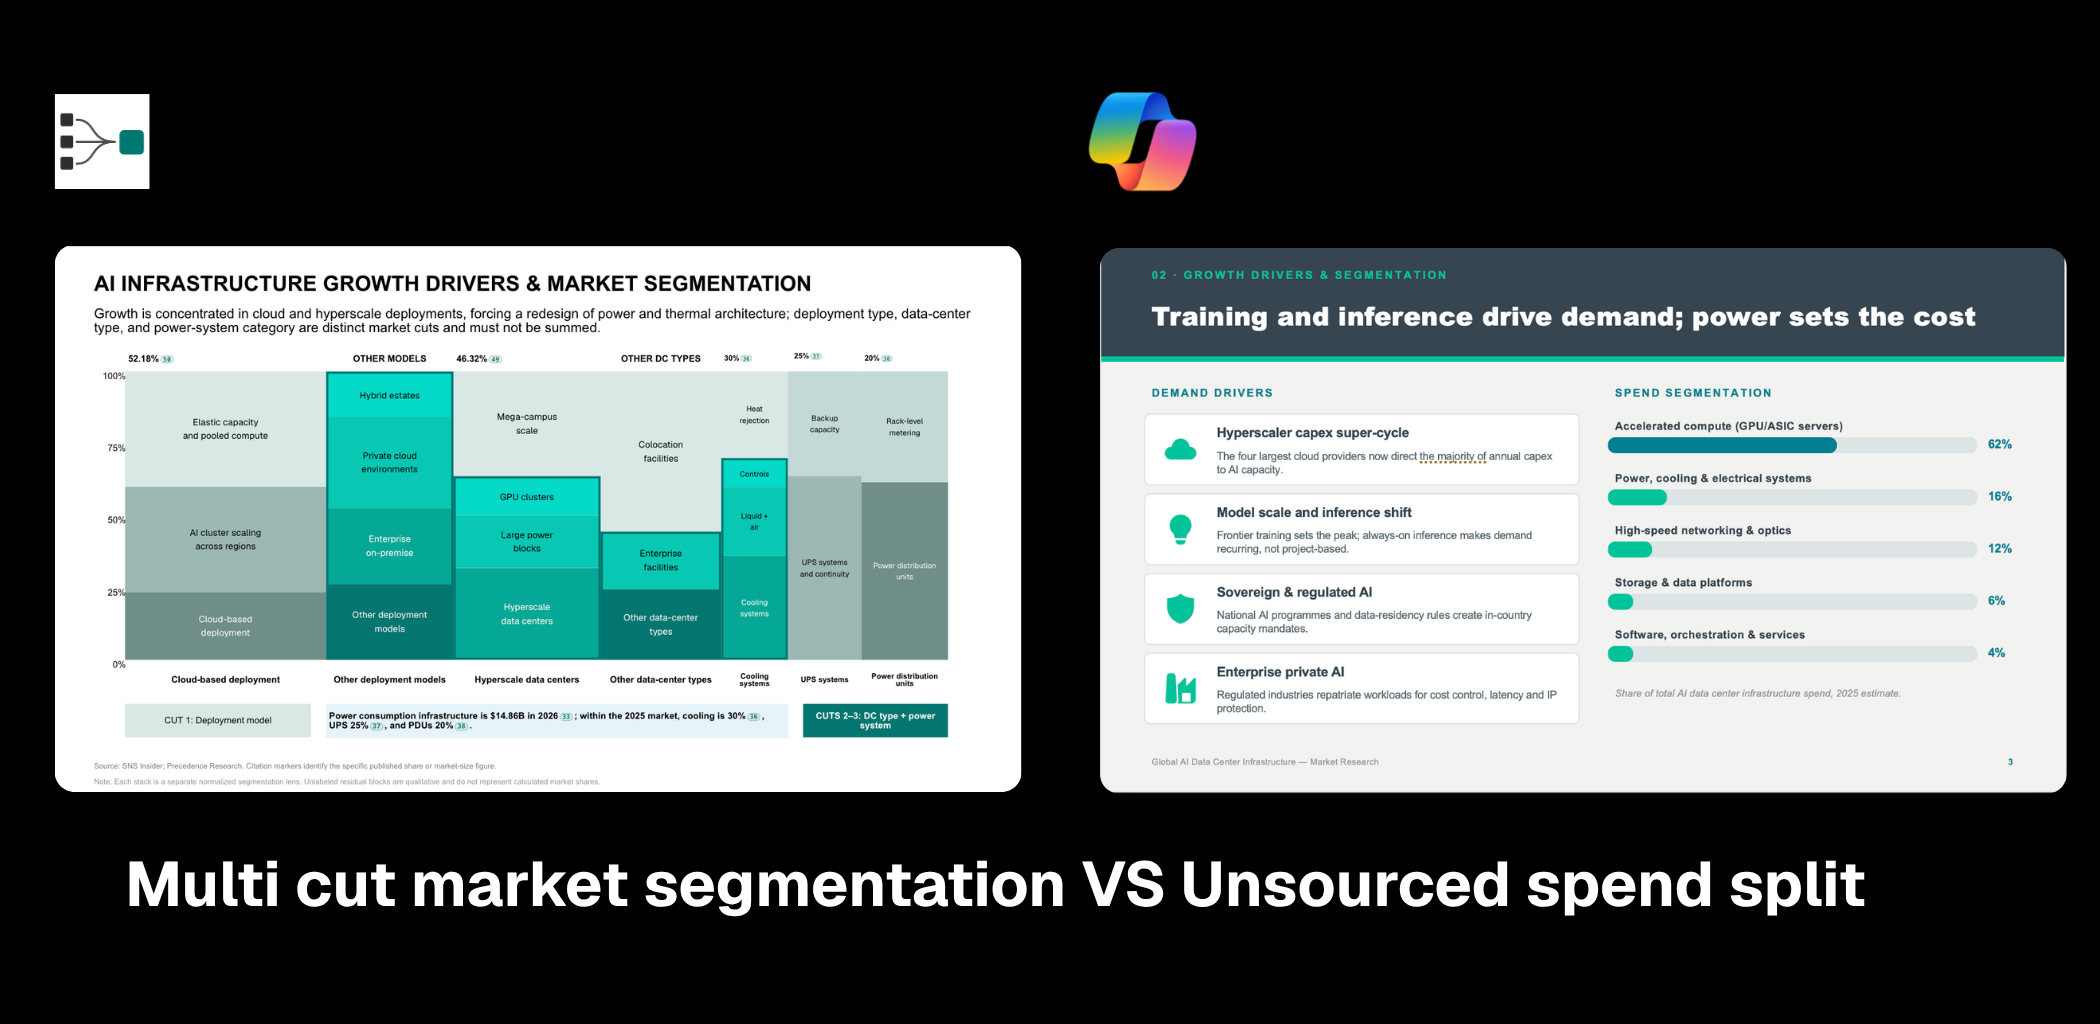
2. Multi-Cut Market Segmentation vs. Unsourced Spend Split
The second test was market segmentation.
Copilot: Split the market into a handful of broad buckets and attached a spend or revenue split to each one — without showing where the split came from. One cut, no sourcing, and no way to check whether the percentages were real or approximated to look reasonable.
WinningStrategy.ai: Cut the market multiple ways — by product, by channel, by price tier, by buyer type — and sized each segment with sourced data, so the segmentation actually explains how the market behaves rather than just how it's labeled.
A single spend split tells you how a market is divided today. Multiple cuts, each sourced, tell you where the market is moving and why — which is the difference between a chart and an analysis.
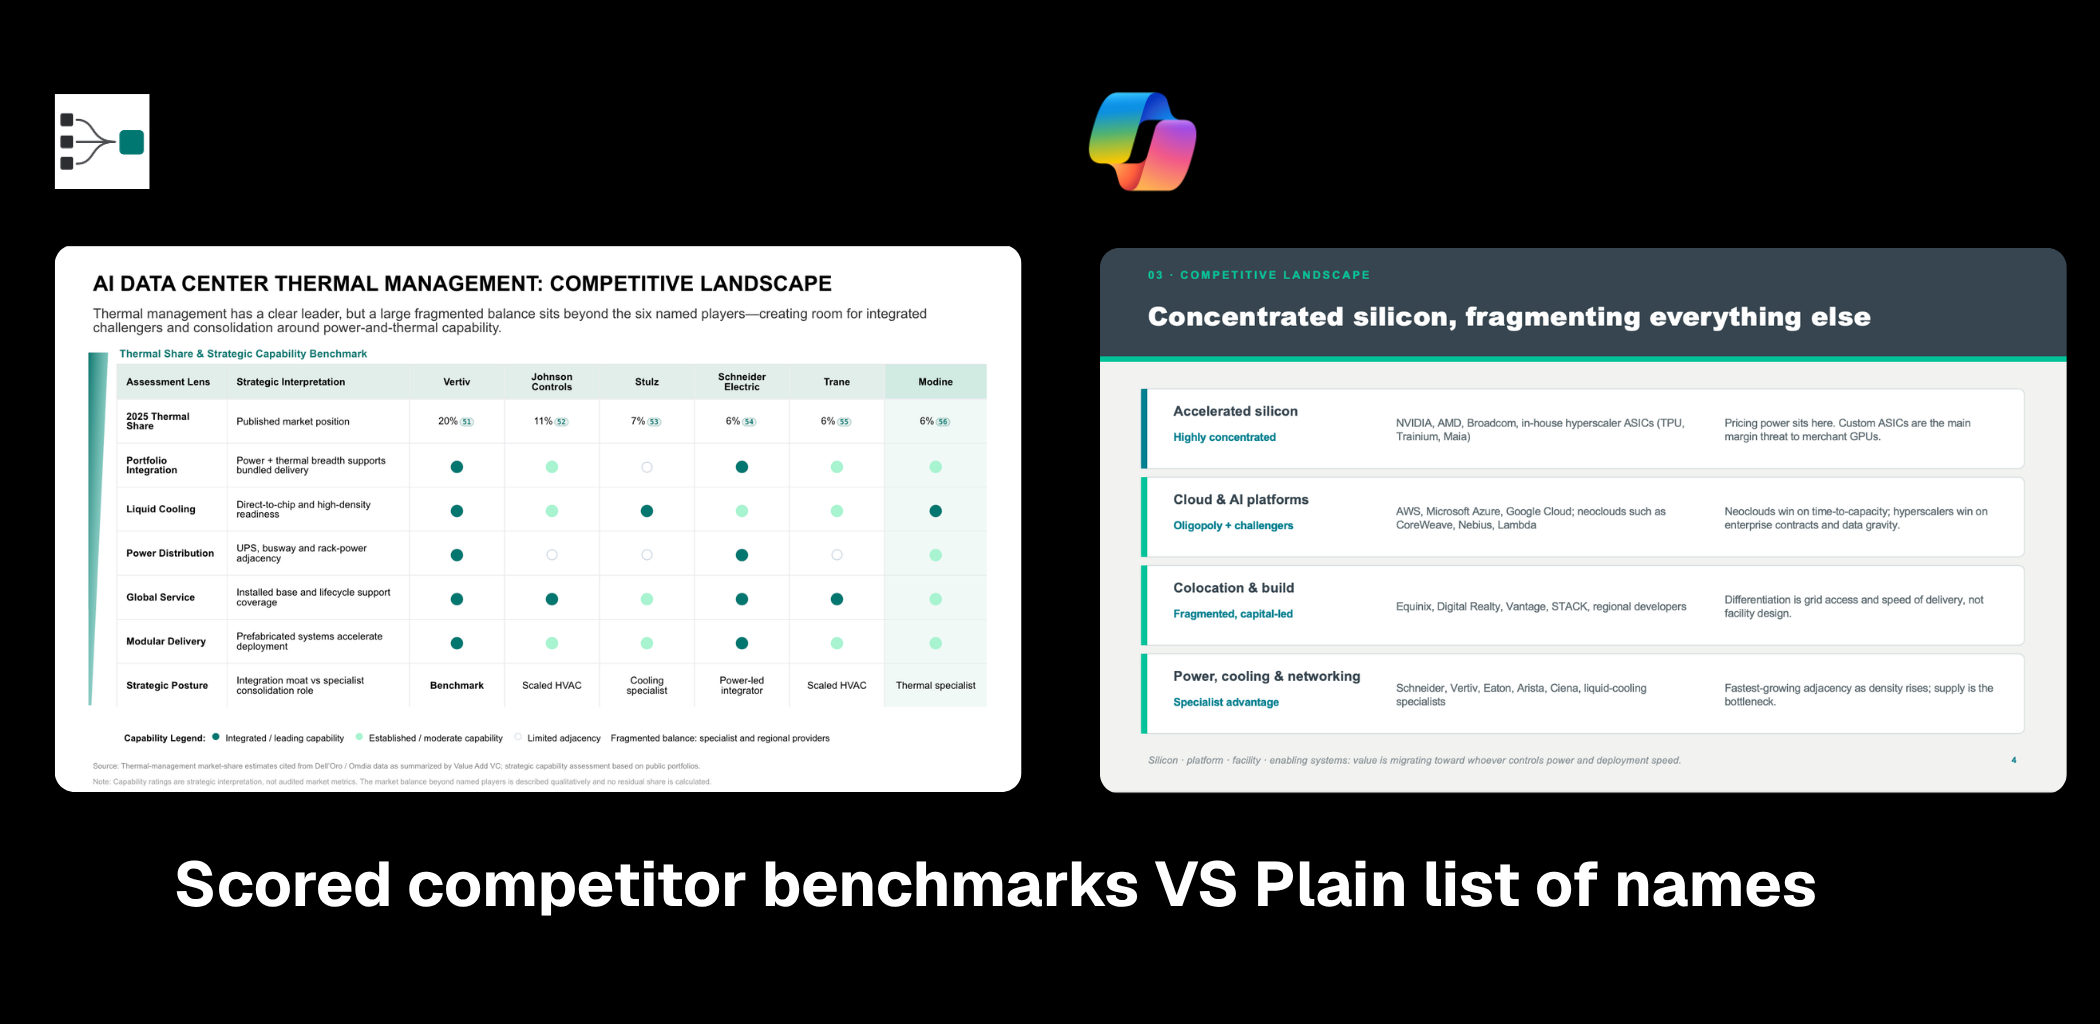
3. Scored Competitor Benchmarks vs. a Plain List of Names
We then compared how each tool approached competitors.
Copilot: Returned a list of competitor names with a short description next to each one. It reads like a directory, not an analysis — useful for knowing who's in the market, but silent on who's actually winning and why.
WinningStrategy.ai: Scored competitors across the dimensions that actually matter — pricing, product breadth, market share, positioning — and turned the comparison into a structured benchmark instead of a name list.
For consulting work, the objective is not simply to identify competitors. It is to understand how they differ, where they are positioned, and what those differences mean for the client's strategy.
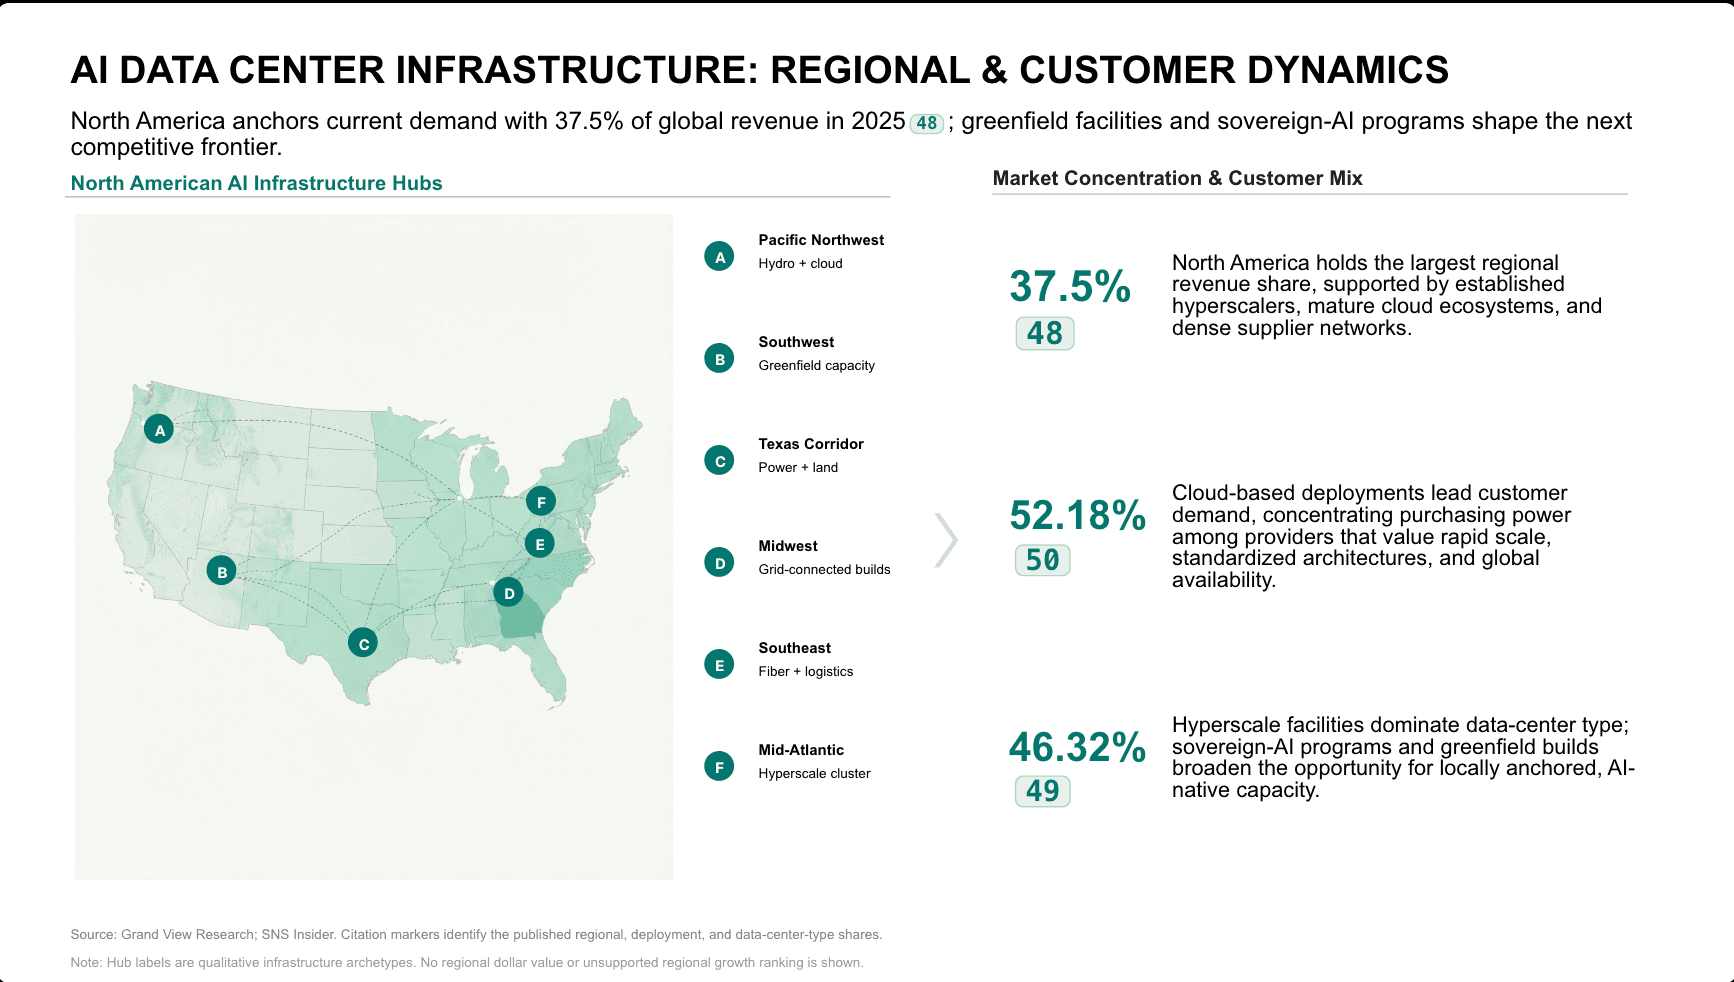
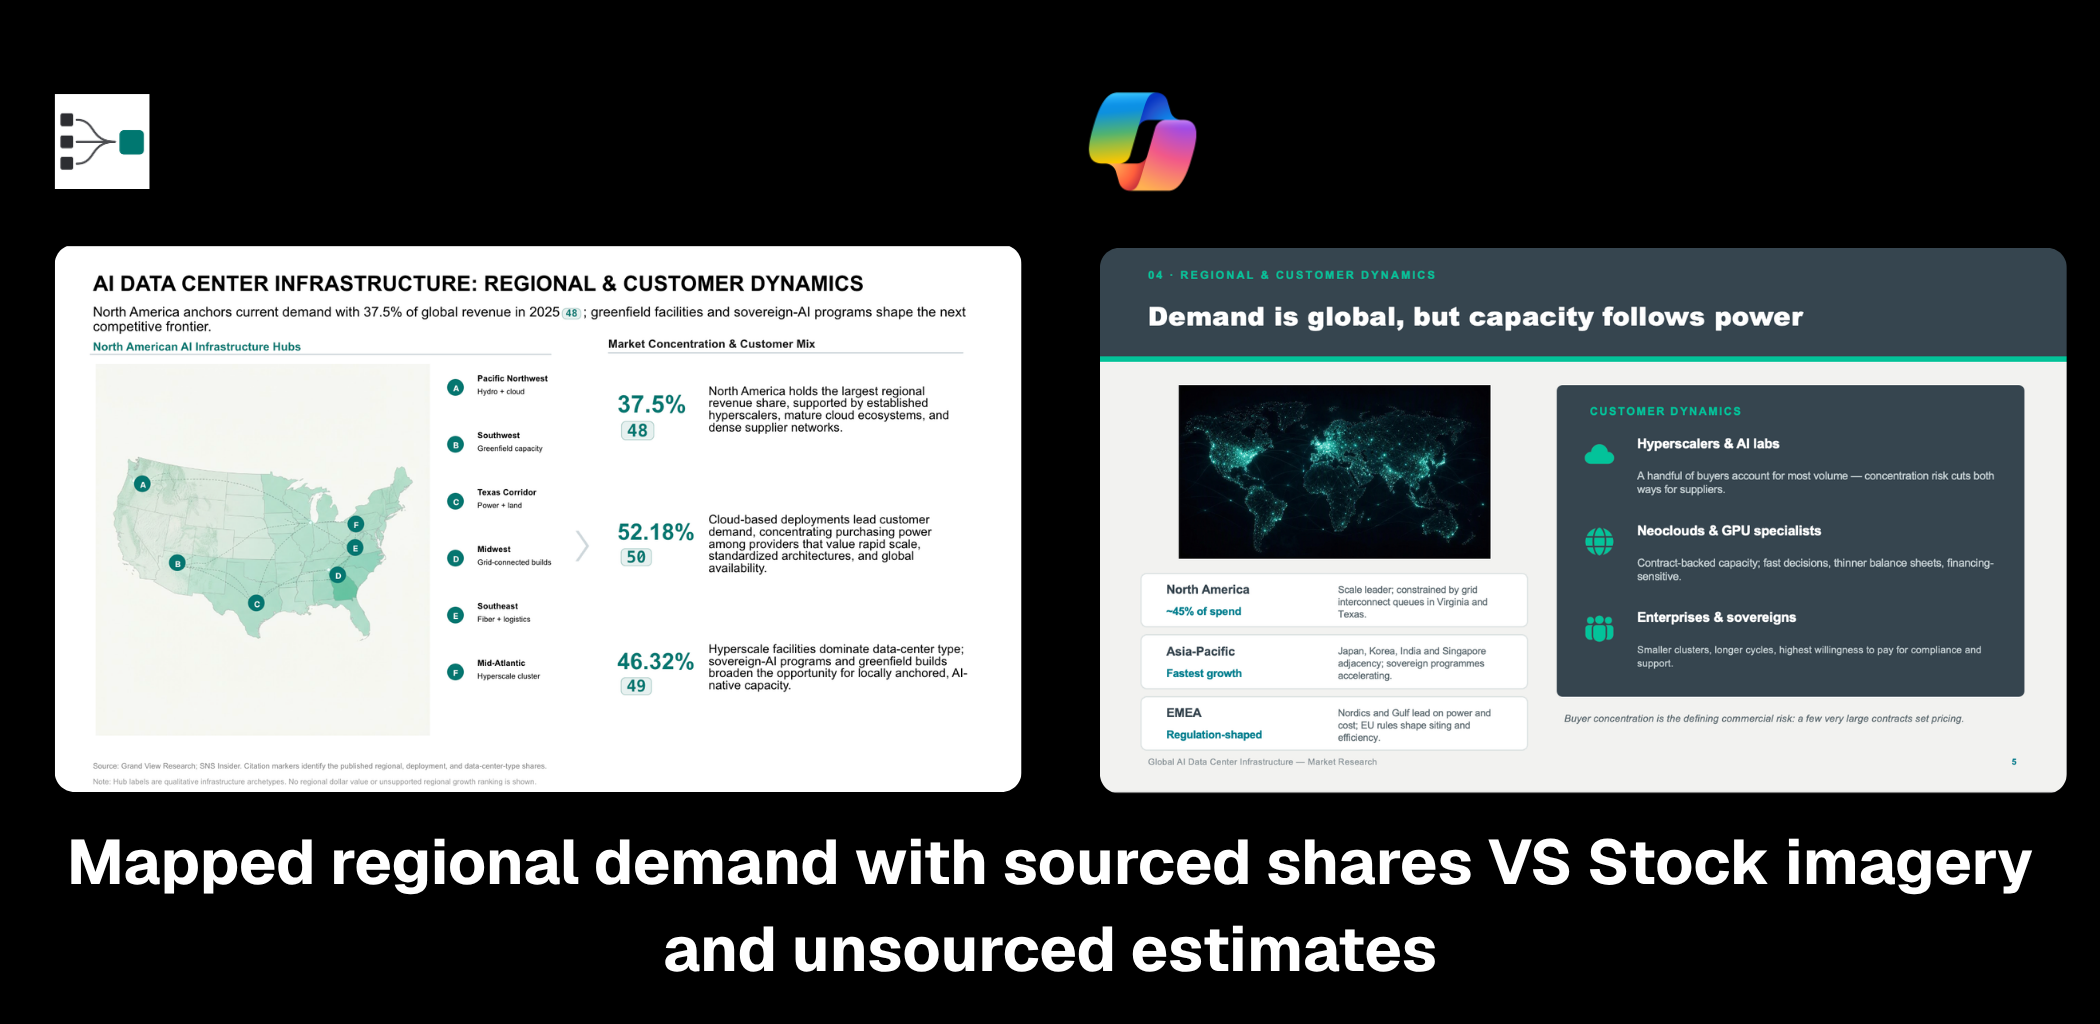
4. Mapped Regional Demand with Sourced Shares vs. Stock Imagery and Unsourced Estimates
The next test was geographic analysis.
Copilot: Filled the slide with a stock world map image and a few unsourced percentage estimates dropped next to each region. It looks like a geography slide, but there's no underlying data behind the shares shown.
WinningStrategy.ai: Mapped regional demand with sourced market shares for each region, tying the geographic breakdown back to real data rather than a decorative map.
Regional analysis becomes useful when it explains where the market is concentrated, how demand differs by region, and where the sourced numbers point to real opportunity — not when it's a map image with guessed percentages attached.
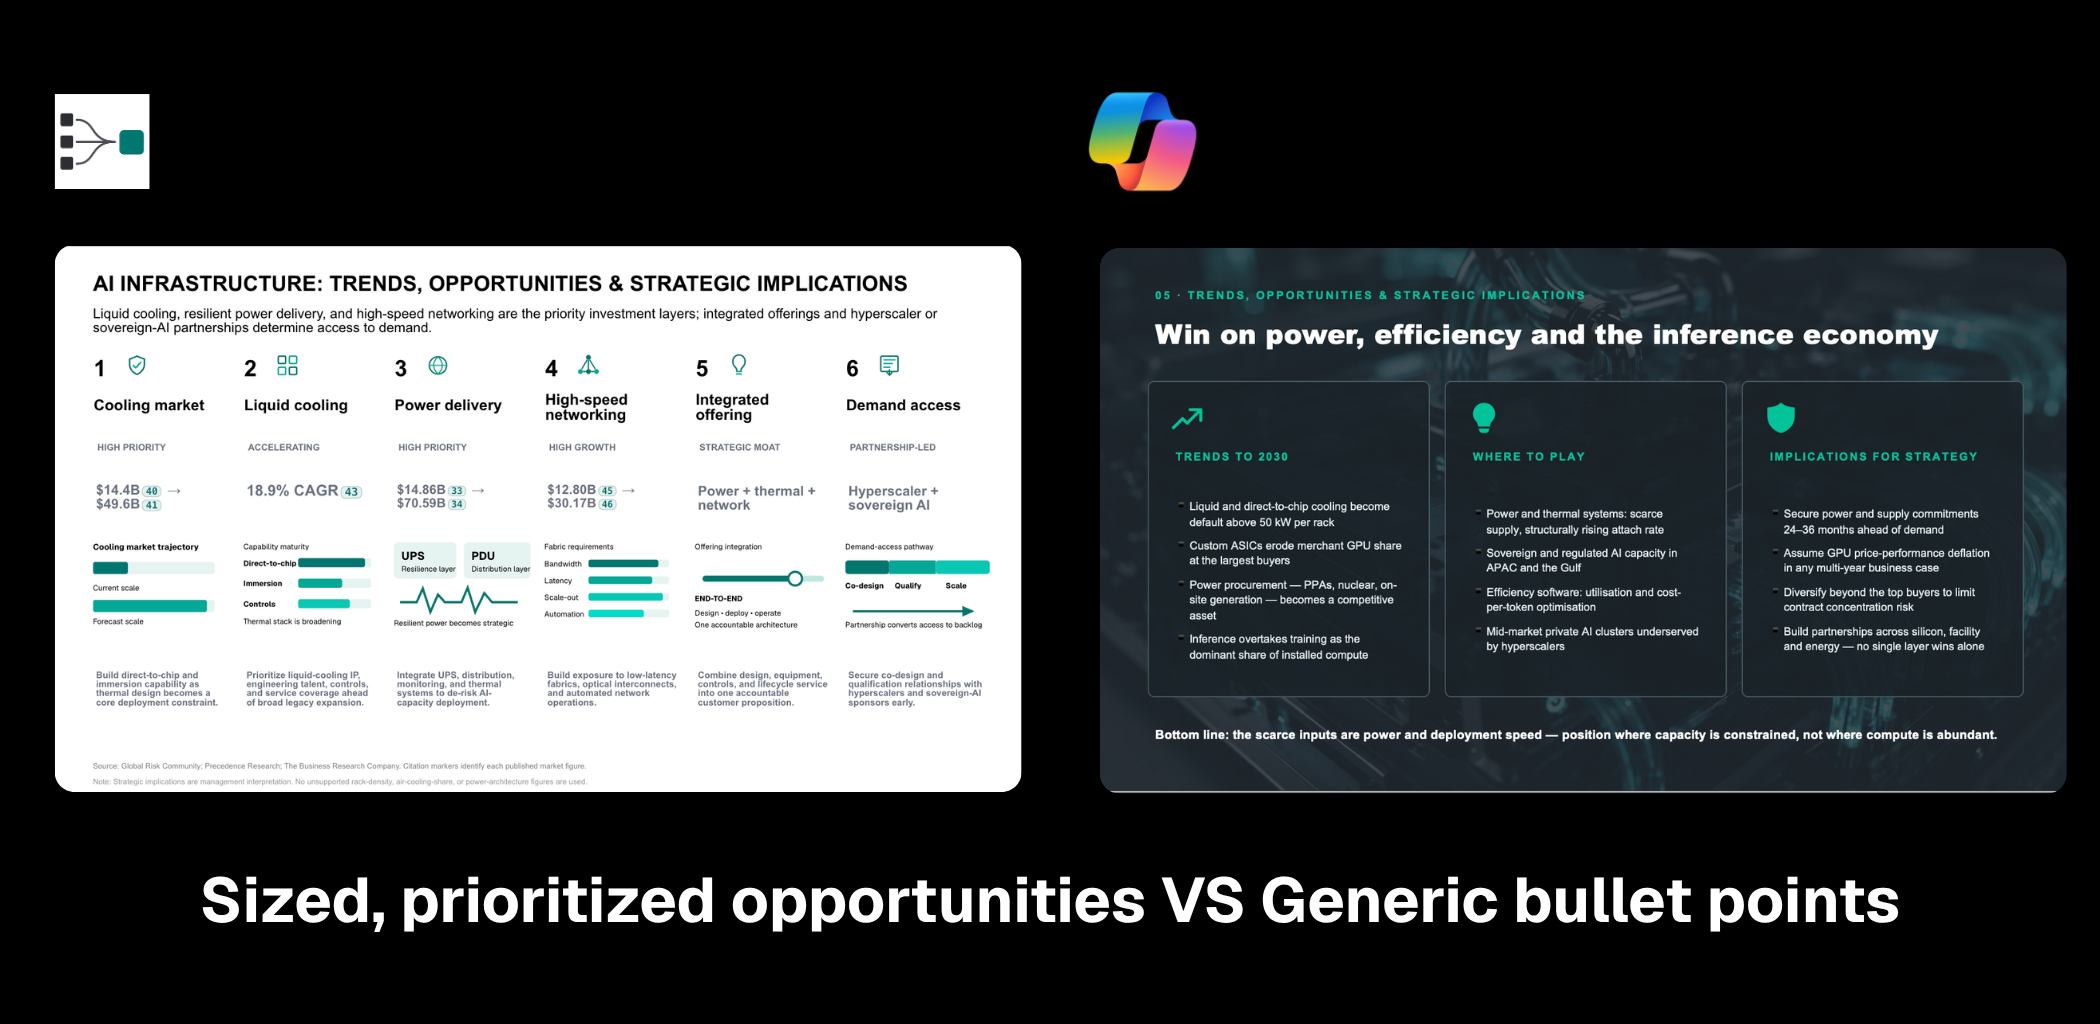
5. Sized, Prioritized Opportunities vs. Generic Bullet Points
The final test was perhaps the most important.
Could the research actually lead to a strategic conclusion?
Copilot: Closed with a slide of generic bullet points — "expand into new markets," "invest in partnerships," "focus on innovation." Each one could apply to almost any company in any industry. None of them were sized, ranked, or tied back to the research on the slides before it.
WinningStrategy.ai: Closed by sizing each opportunity and ranking them by priority, connecting the research, segmentation, competitor benchmarks and regional data into a recommendation that's specific to this market, not a generic strategy template.
A consulting presentation is not valuable because it contains five attractive slides. It is valuable because the analysis helps answer: What is happening? Why does it matter? And what should the client do about it, in what order?
Consulting AI Needs to Do More Than Generate Slides
This test highlights a broader difference between general-purpose AI and AI designed around consulting workflows.
Presentation generation is only one part of consulting work.
A typical market research project requires:
- Research and source validation
- Market segmentation
- Competitor benchmarking
- Regional and industry analysis
- Strategic frameworks
- Synthesis of evidence into insights
- A clear, defensible storyline
- Final presentation development
An AI tool that only generates slides can make the last step faster.
An AI Analyst built around the entire workflow can accelerate the work that happens before the slides are created.
That is the difference we are building with WinningStrategy.ai.
Research the market. Analyse the evidence. Build the story. Create the presentation.
All in minutes, with numbers that can be traced back to their sources.
WinningStrategy.ai automates the research, analysis and storytelling behind every consulting presentation — not just the slides.
AI Analyst that delivers the work of a consulting team, in minutes
Every number auditable, so you can defend it with confidence